Open to new work
REMOTE, WORLDWIDE

Bureau6
I wanted to see how every US state is doing in one place, without opening ten government spreadsheets. So I built it on my own in two days, and it’s live.
Year
2026
Role
Design and build, solo
Platform
Web and phone
Status
Live
Why I built it
Every few weeks a new “best and worst states” chart goes around, and they never agree. The real numbers are public, but they’re spread across three agencies. I wanted one map where you click a state and see all of it.
What I did
All of it: the design, the 3D map, the data from three US government agencies, and the launch.
How fast
From a blank page to live in 2 days.
01
One map, ten numbers
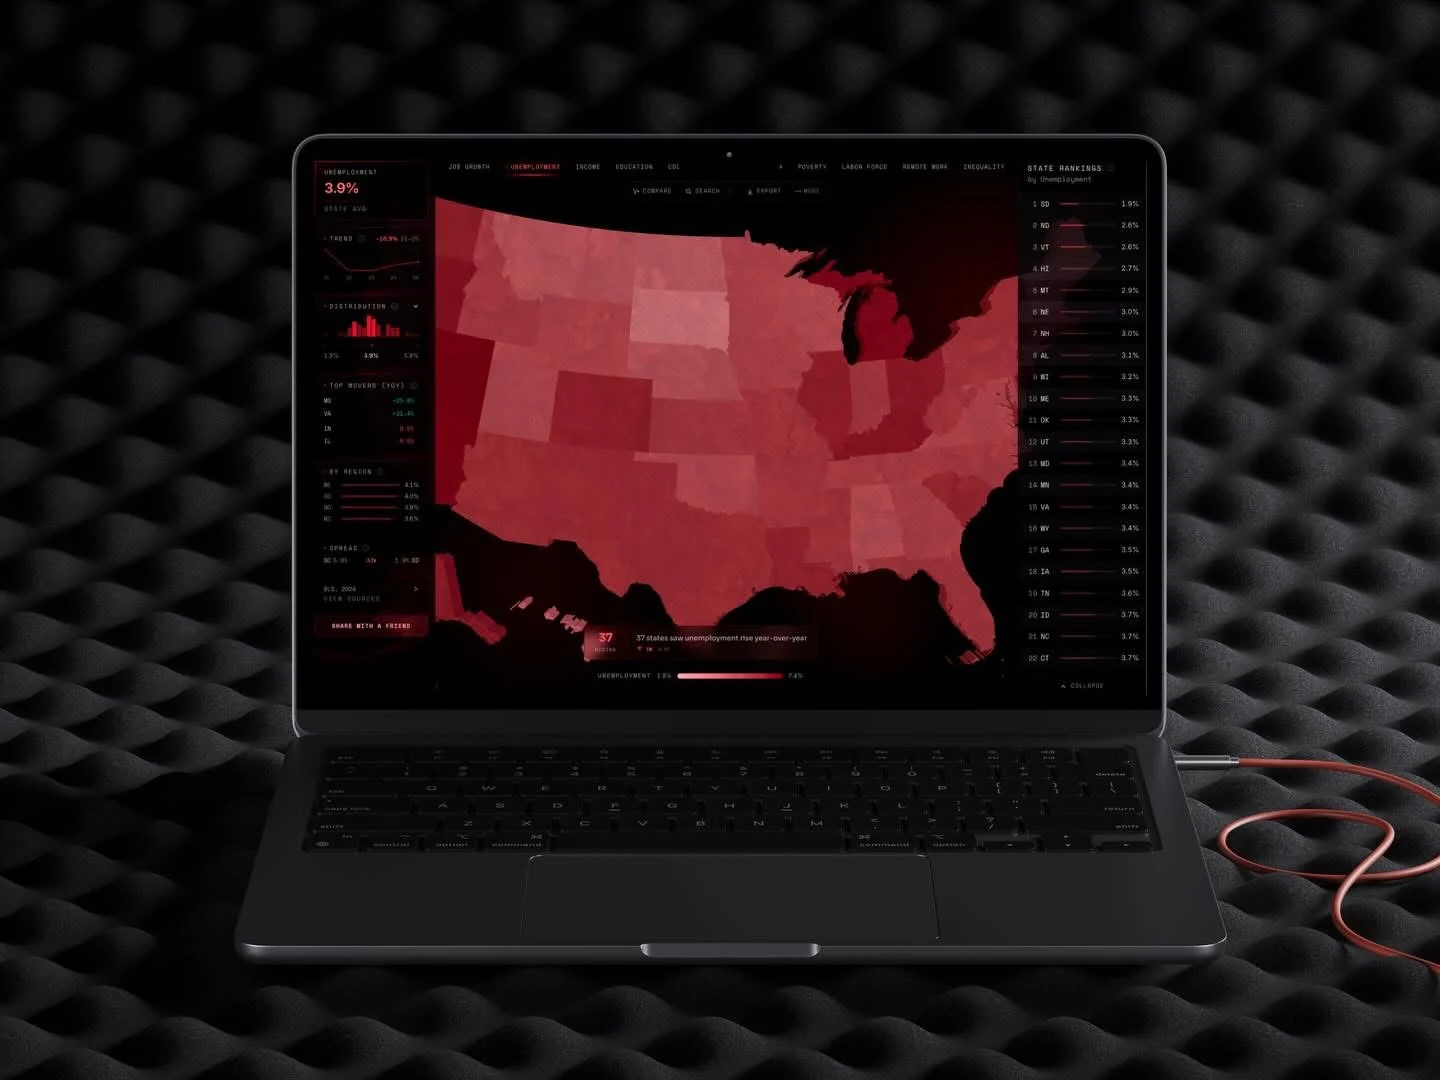
People open it with one question: how is my state doing? So the map is the first thing you see. Pick one of ten indicators along the top and every state takes its colour. Click a state and the camera flies to it, with its numbers beside it.
02
Compare two states
The next question is always “compared to where?” Pick any two states and every indicator lines up side by side, with a radar of where each one ranks.
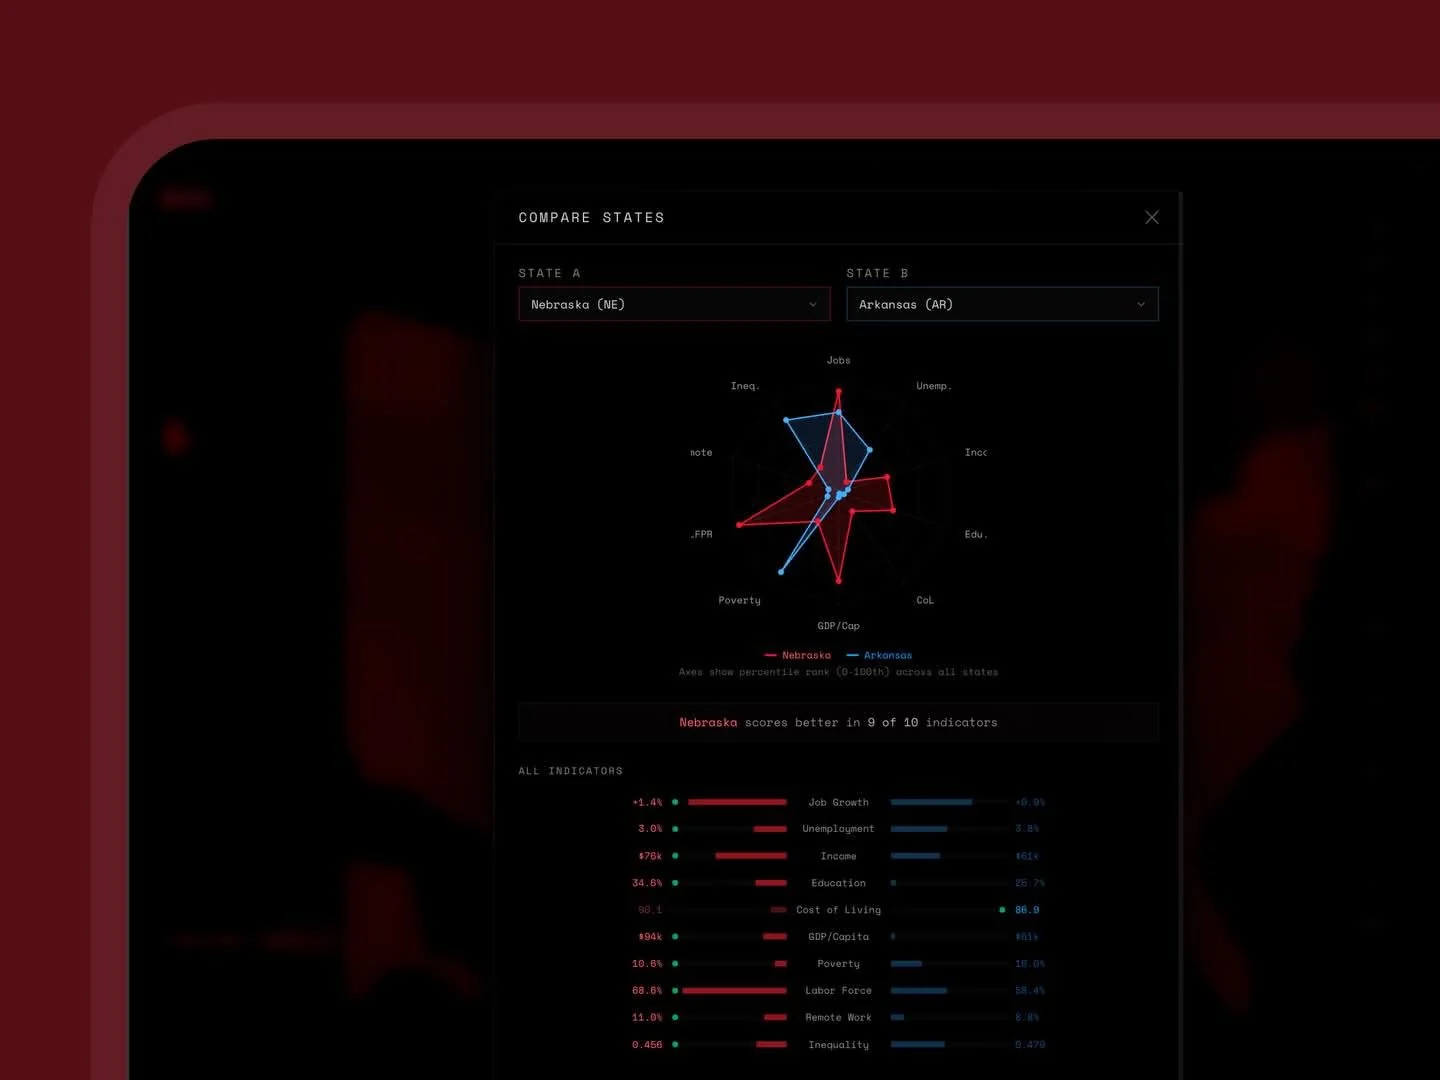
Nebraska comes out ahead on 9 of the 10.
03
Made for the phone too
Most people open a link like this on their phone, so the map and each state’s profile work on small screens, and the site installs like an app.

04
Built to stay up
Government data sites go down more often than you’d think. Bureau6 pulls from the Bureau of Labor Statistics, the Census Bureau and the Bureau of Economic Analysis once a day. If a source fails, the site serves the last good copy and keeps working.
05
What I left out
Two days meant saying no a lot: no accounts, no saved views, no county data. Counties come next, because they’re the first thing people ask for.
More work
Want one
like this?
Tell me what you’re building. I’ll tell you how I’d design, build and ship it.