GODWIN LAURETO

Open to new work

REMOTE, WORLDWIDE
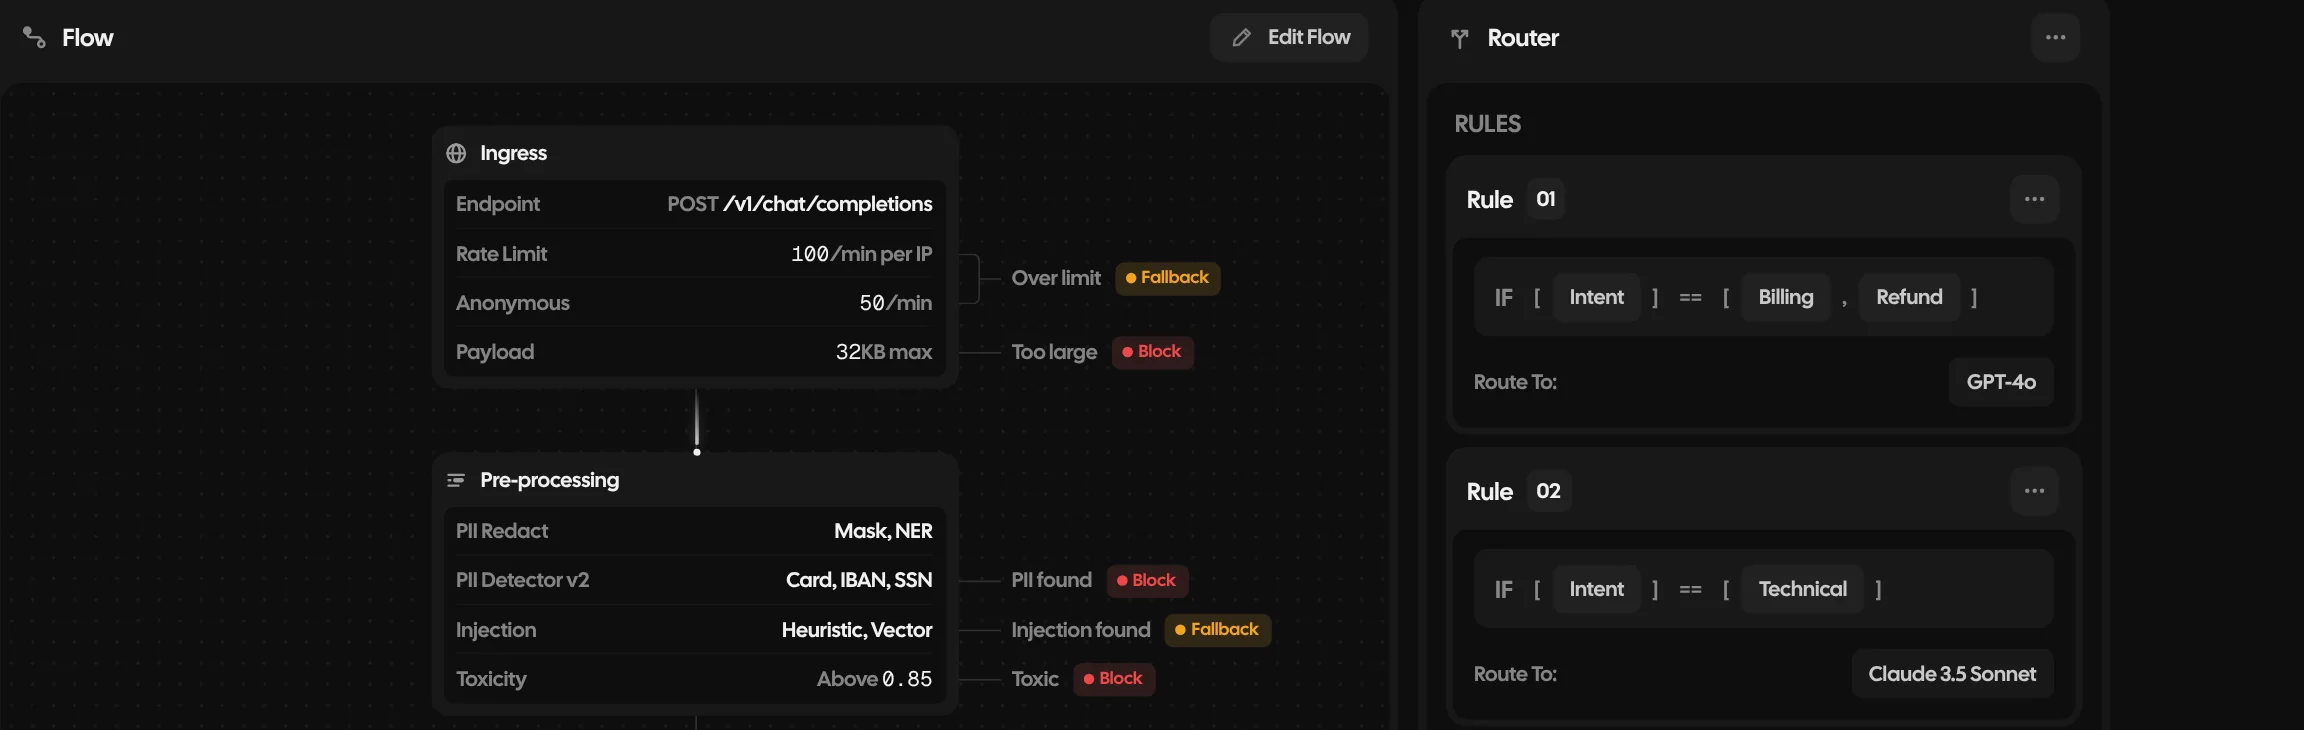
The pipeline drawn as a flow: rate limits, checks for personal data, injection and toxicity, then a router, with the router’s rules beside it
Back to work

Pipeline

Client work: a dashboard for a team running AI models in production. Every request, what it cost, how long it took and what the guardrails stopped, per pipeline. Every screen here is from the working prototype.

Year

2026

Role

Design and prototype

Platform

Web

Status

Client work

What it is

A dashboard for a company’s AI pipelines: the traffic, speed and cost of each one, and every request the guardrails stopped.

What I did

The design and a working prototype: the overview, the flow, prompts, datasets, logs, usage and cost, and guardrails.

How it works

When a model slows down, a warning sits in the pipeline’s header with a link to its logs.

01

Overview

The last 24 hours in 15-minute buckets: requests, average and p95 latency, cost against yesterday, and blocked requests. Under it, each model’s share of the traffic and the cost, and the latest guardrail exceptions with what was done about each.
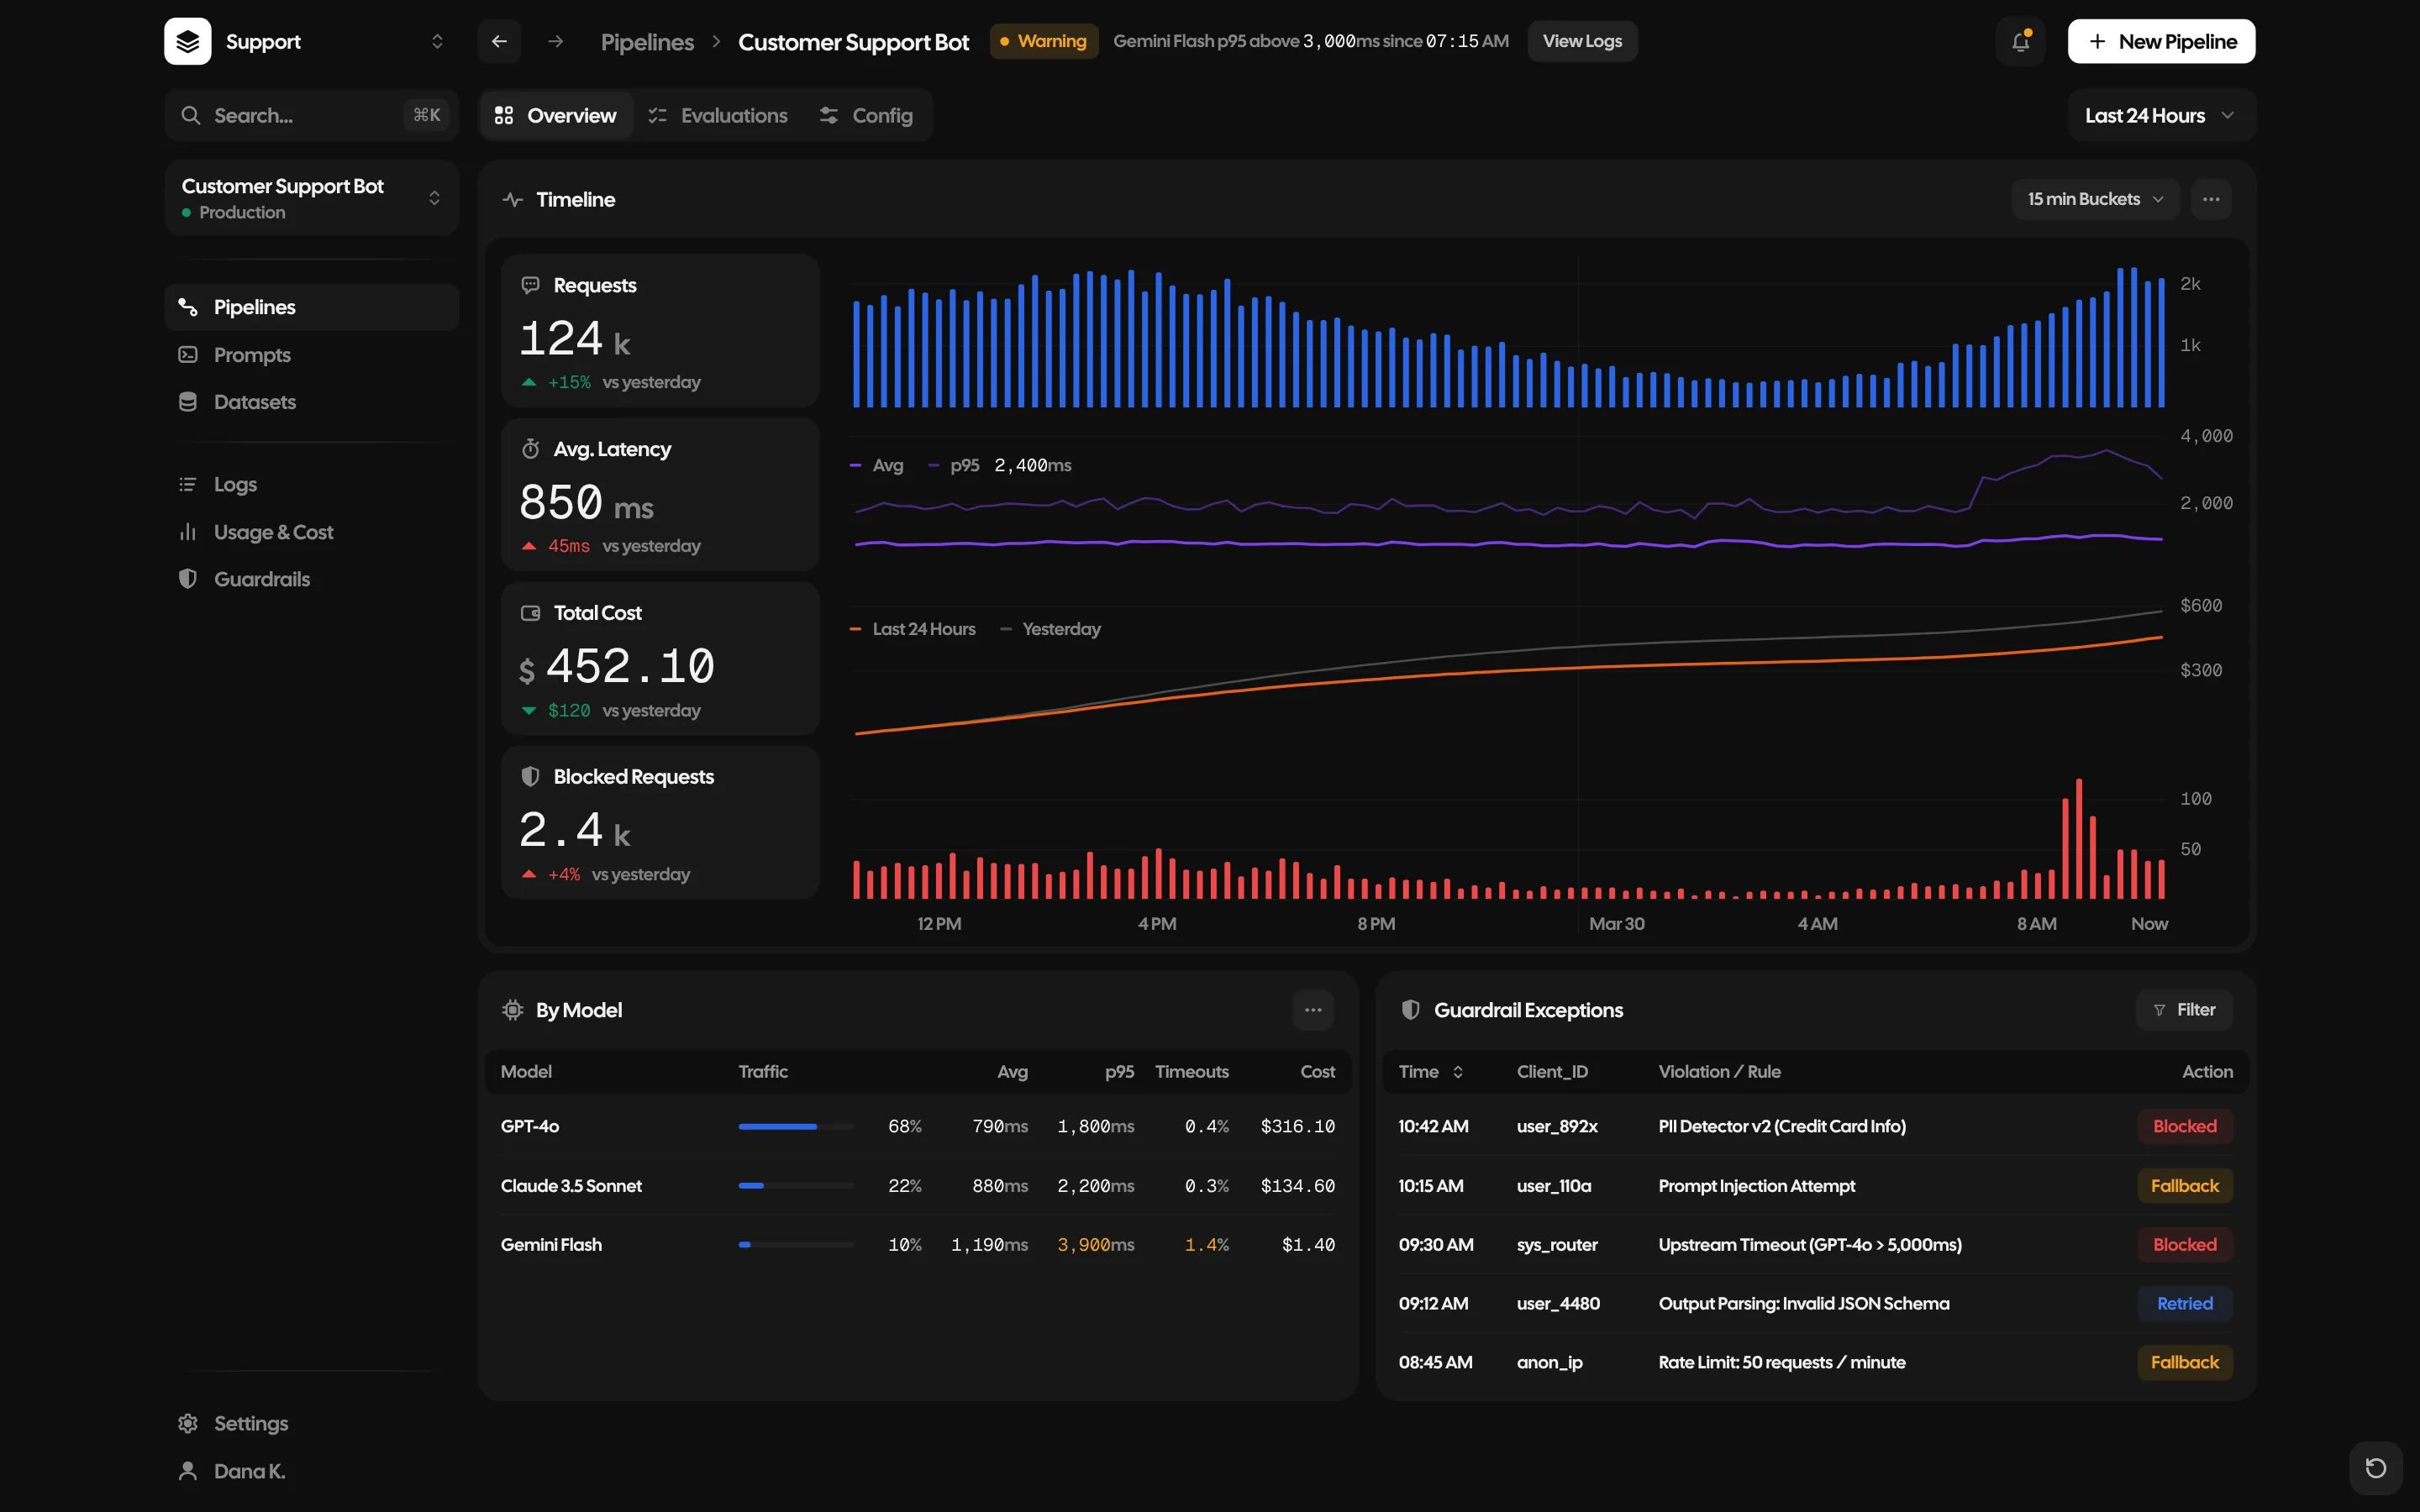
The Customer Support Bot overview: requests, latency, cost and blocked requests over 24 hours as charts, a table of the three models with traffic, latency, timeouts and cost, and the latest guardrail exceptions, blocked, fallback or retried
Fig. 1
Customer Support Bot, the last 24 hours

02

The flow

Config draws the pipeline as it runs: rate limits on the way in, checks for personal data, prompt injection and toxicity, a router that sends billing and refund questions to GPT-4o and technical ones to Claude 3.5 Sonnet, then a schema check on the way out. Every check says what happens when it fails: block, fall back or retry.
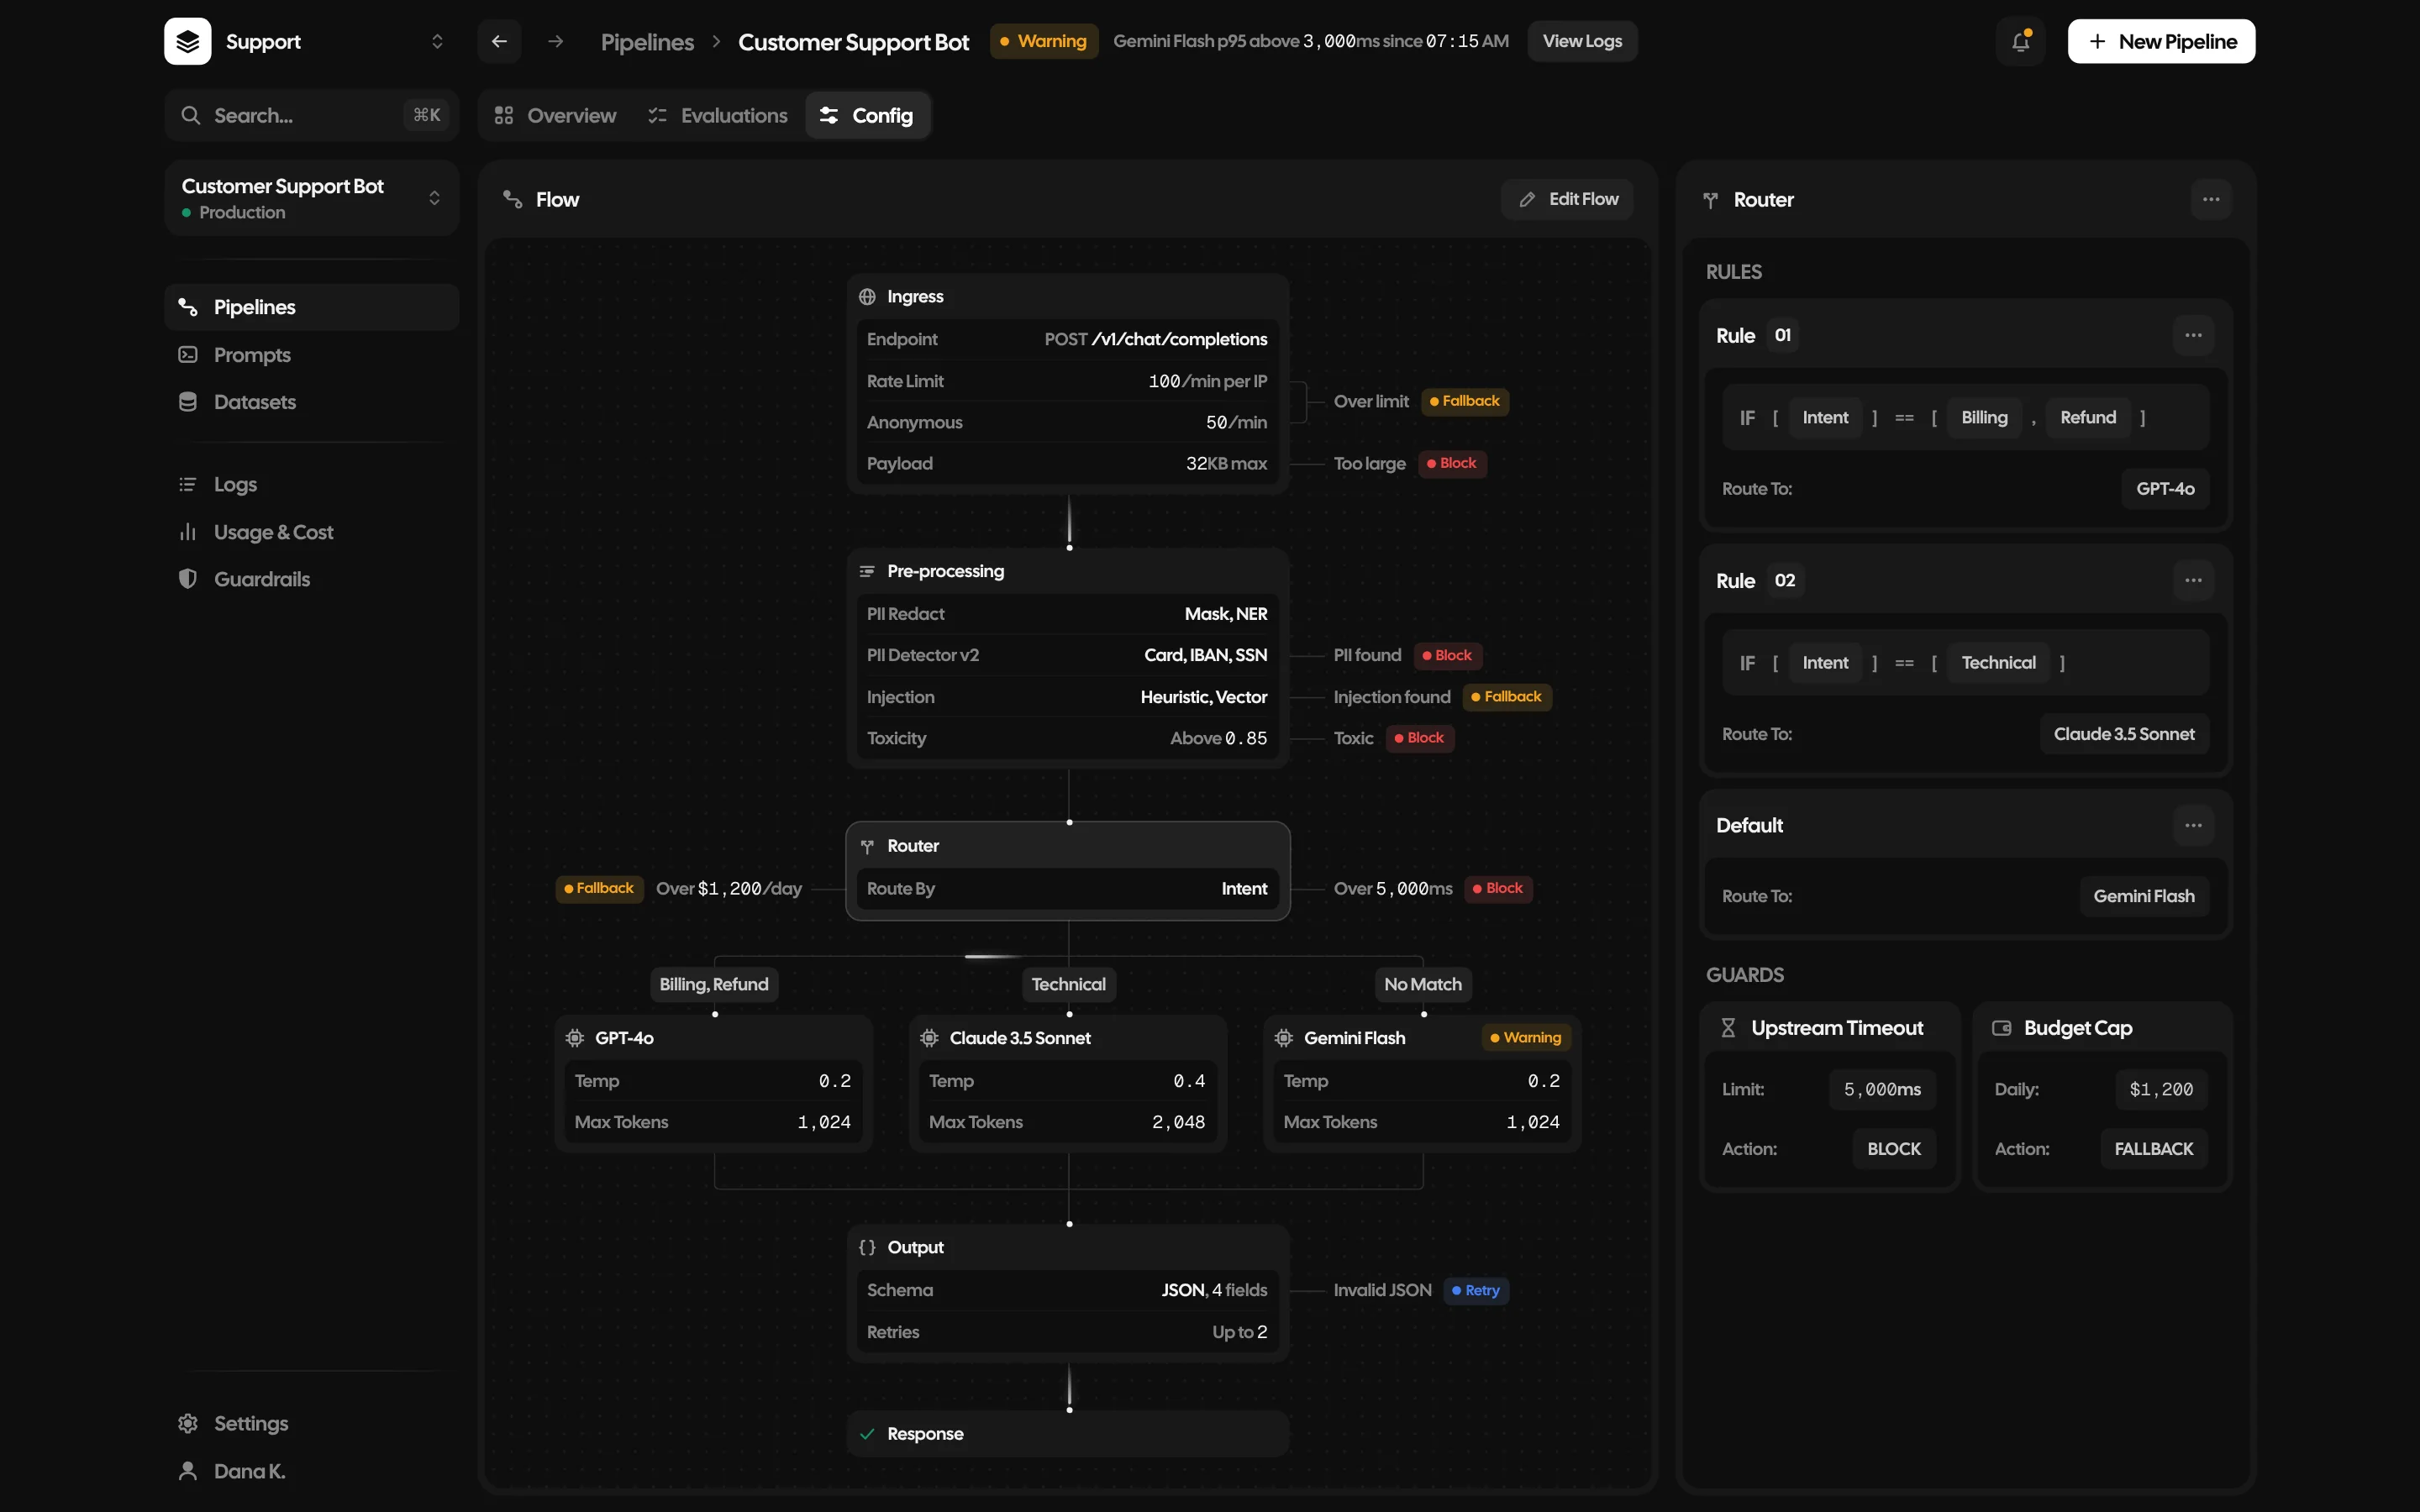
The pipeline’s flow from ingress through pre-processing and the router to three models, the output check and the response, with the router’s rules and guards on the right
Fig. 2
The flow and its router
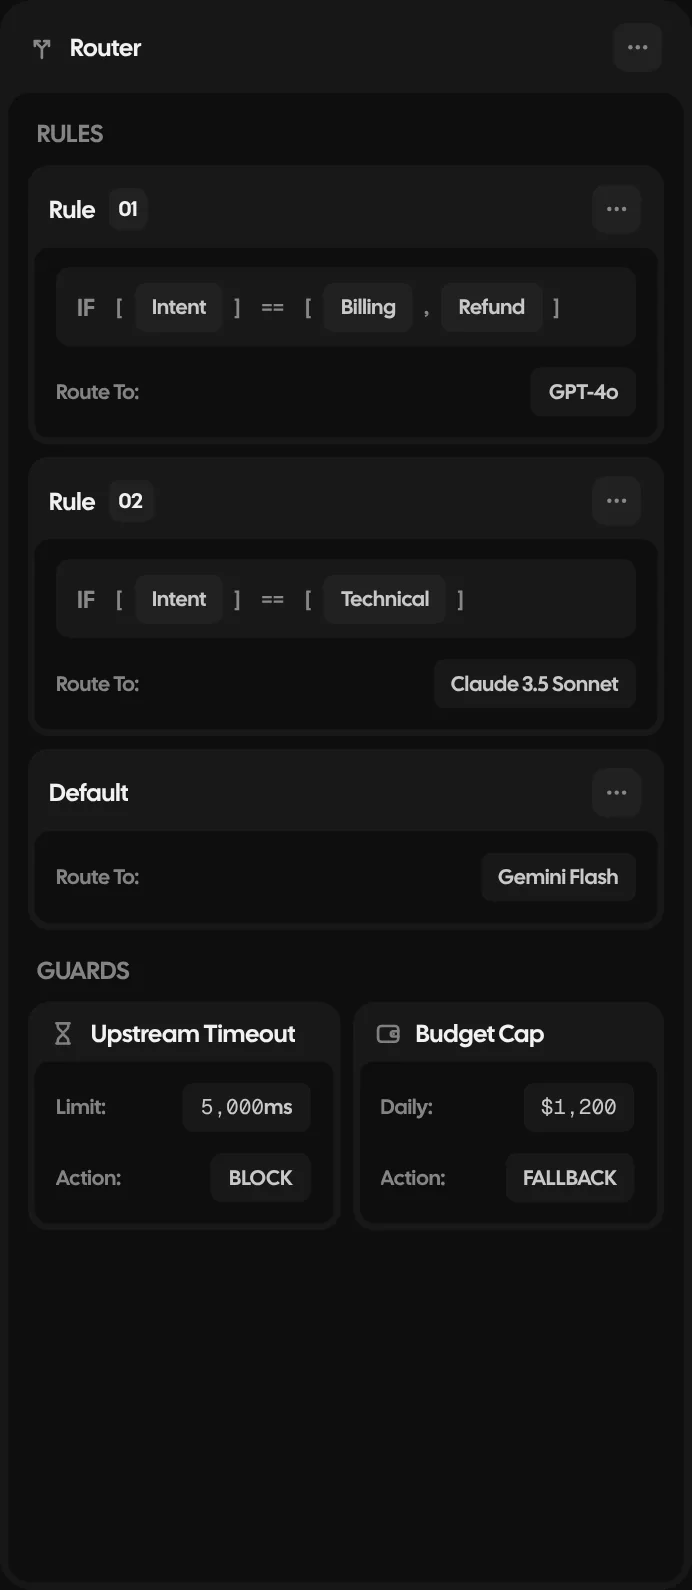
The router: rule 1 sends billing and refund to GPT-4o, rule 2 sends technical to Claude 3.5 Sonnet, the default goes to Gemini Flash, and two guards: a 5,000 ms timeout that blocks and a $1,200 daily cap that falls back
Router

The rules, the default and two guards: a 5,000 ms timeout and a $1,200 daily cap.
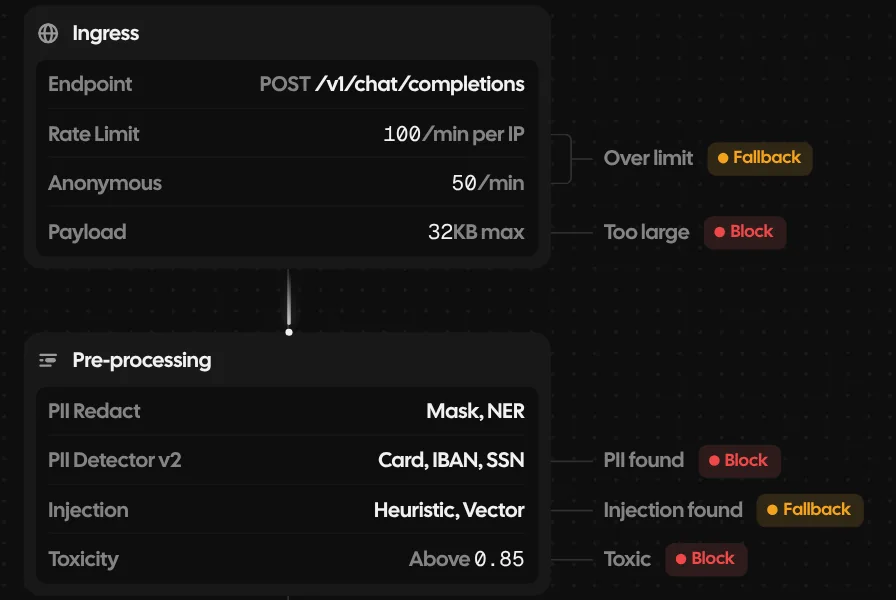
Ingress with its rate limits and payload size, then pre-processing: personal data masked, card and bank numbers detected, injection and toxicity checks, each with what happens when it trips
Checks

Each check with its setting, and what happens when it trips.
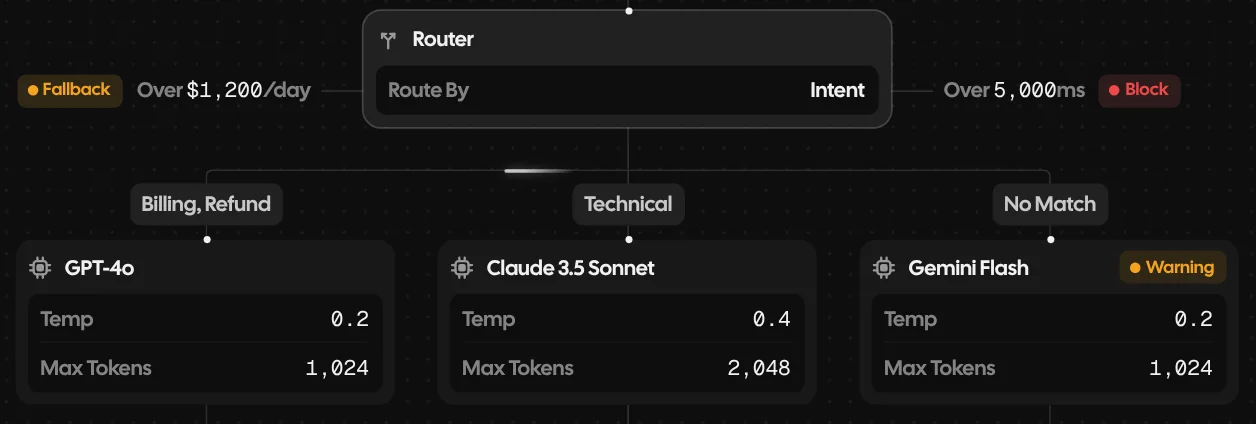
The router sending billing and refund to GPT-4o, technical to Claude 3.5 Sonnet and anything else to Gemini Flash, which carries a warning
Models

Where each kind of question goes.

03

Prompts and datasets

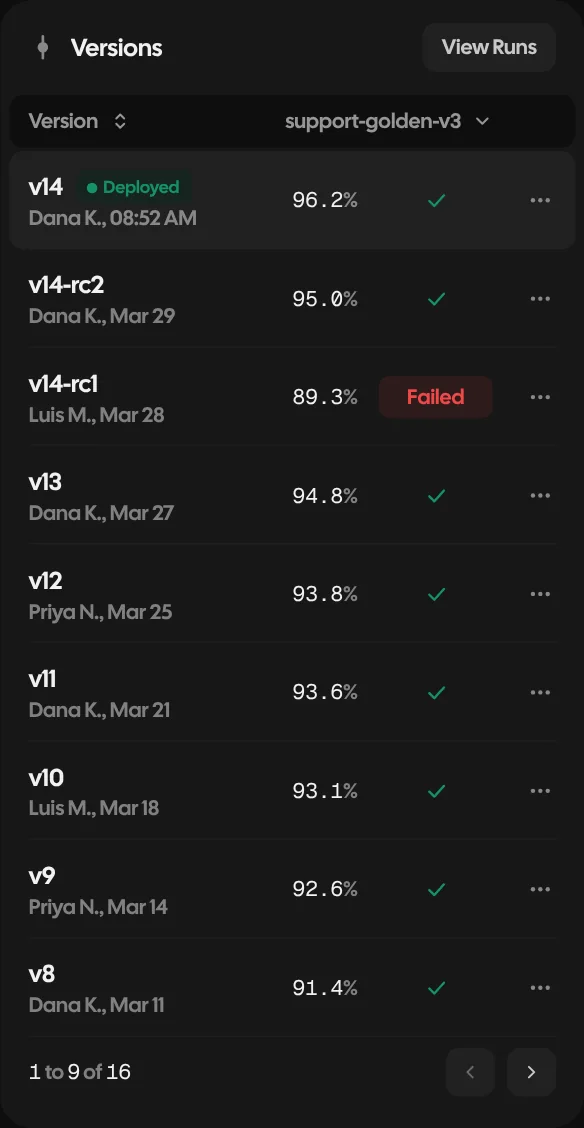
Each prompt keeps its versions with a test score, and a version that fails is marked. Datasets hold example questions with the answer expected and the last score.
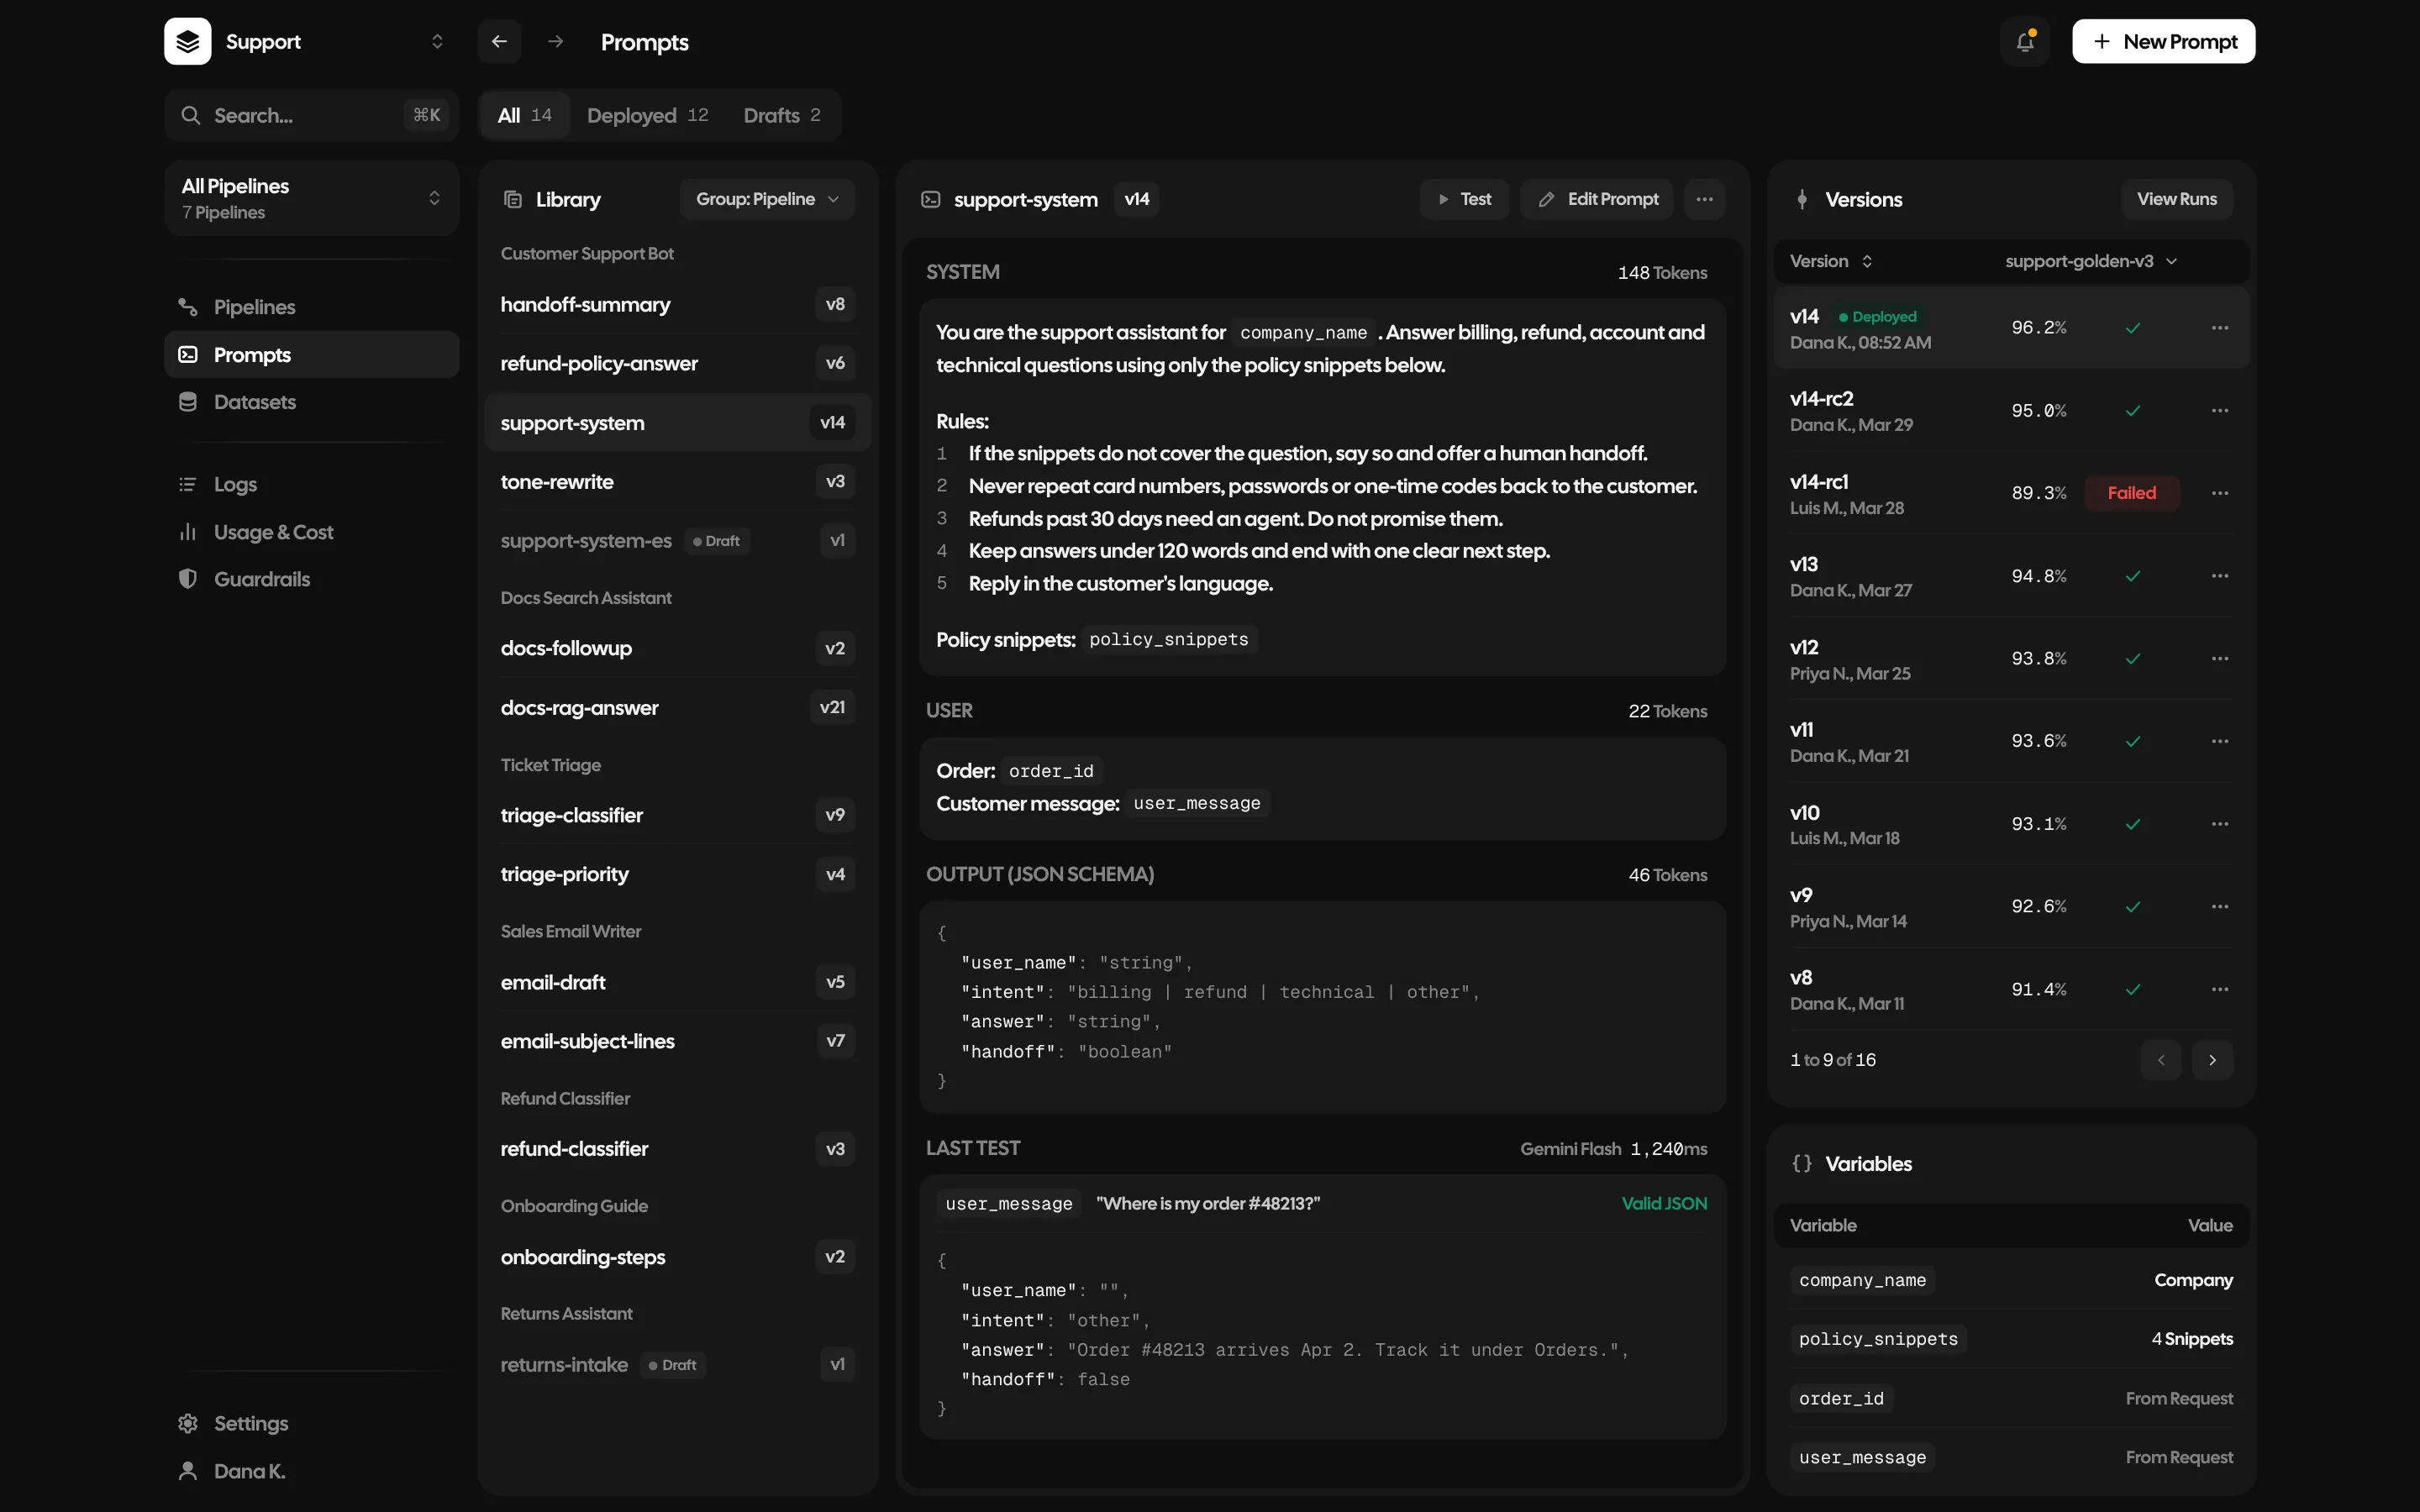
The prompts library: the support-system prompt at version 14 with its rules, the user message and the JSON output, its versions with scores, and its variables
Fig. 3
support-system, version 14
Versions of the support-system prompt with their scores, version 14 deployed at 96.2% and an earlier candidate marked failed at 89.3%
Versions

Each version’s score, and the one that failed.
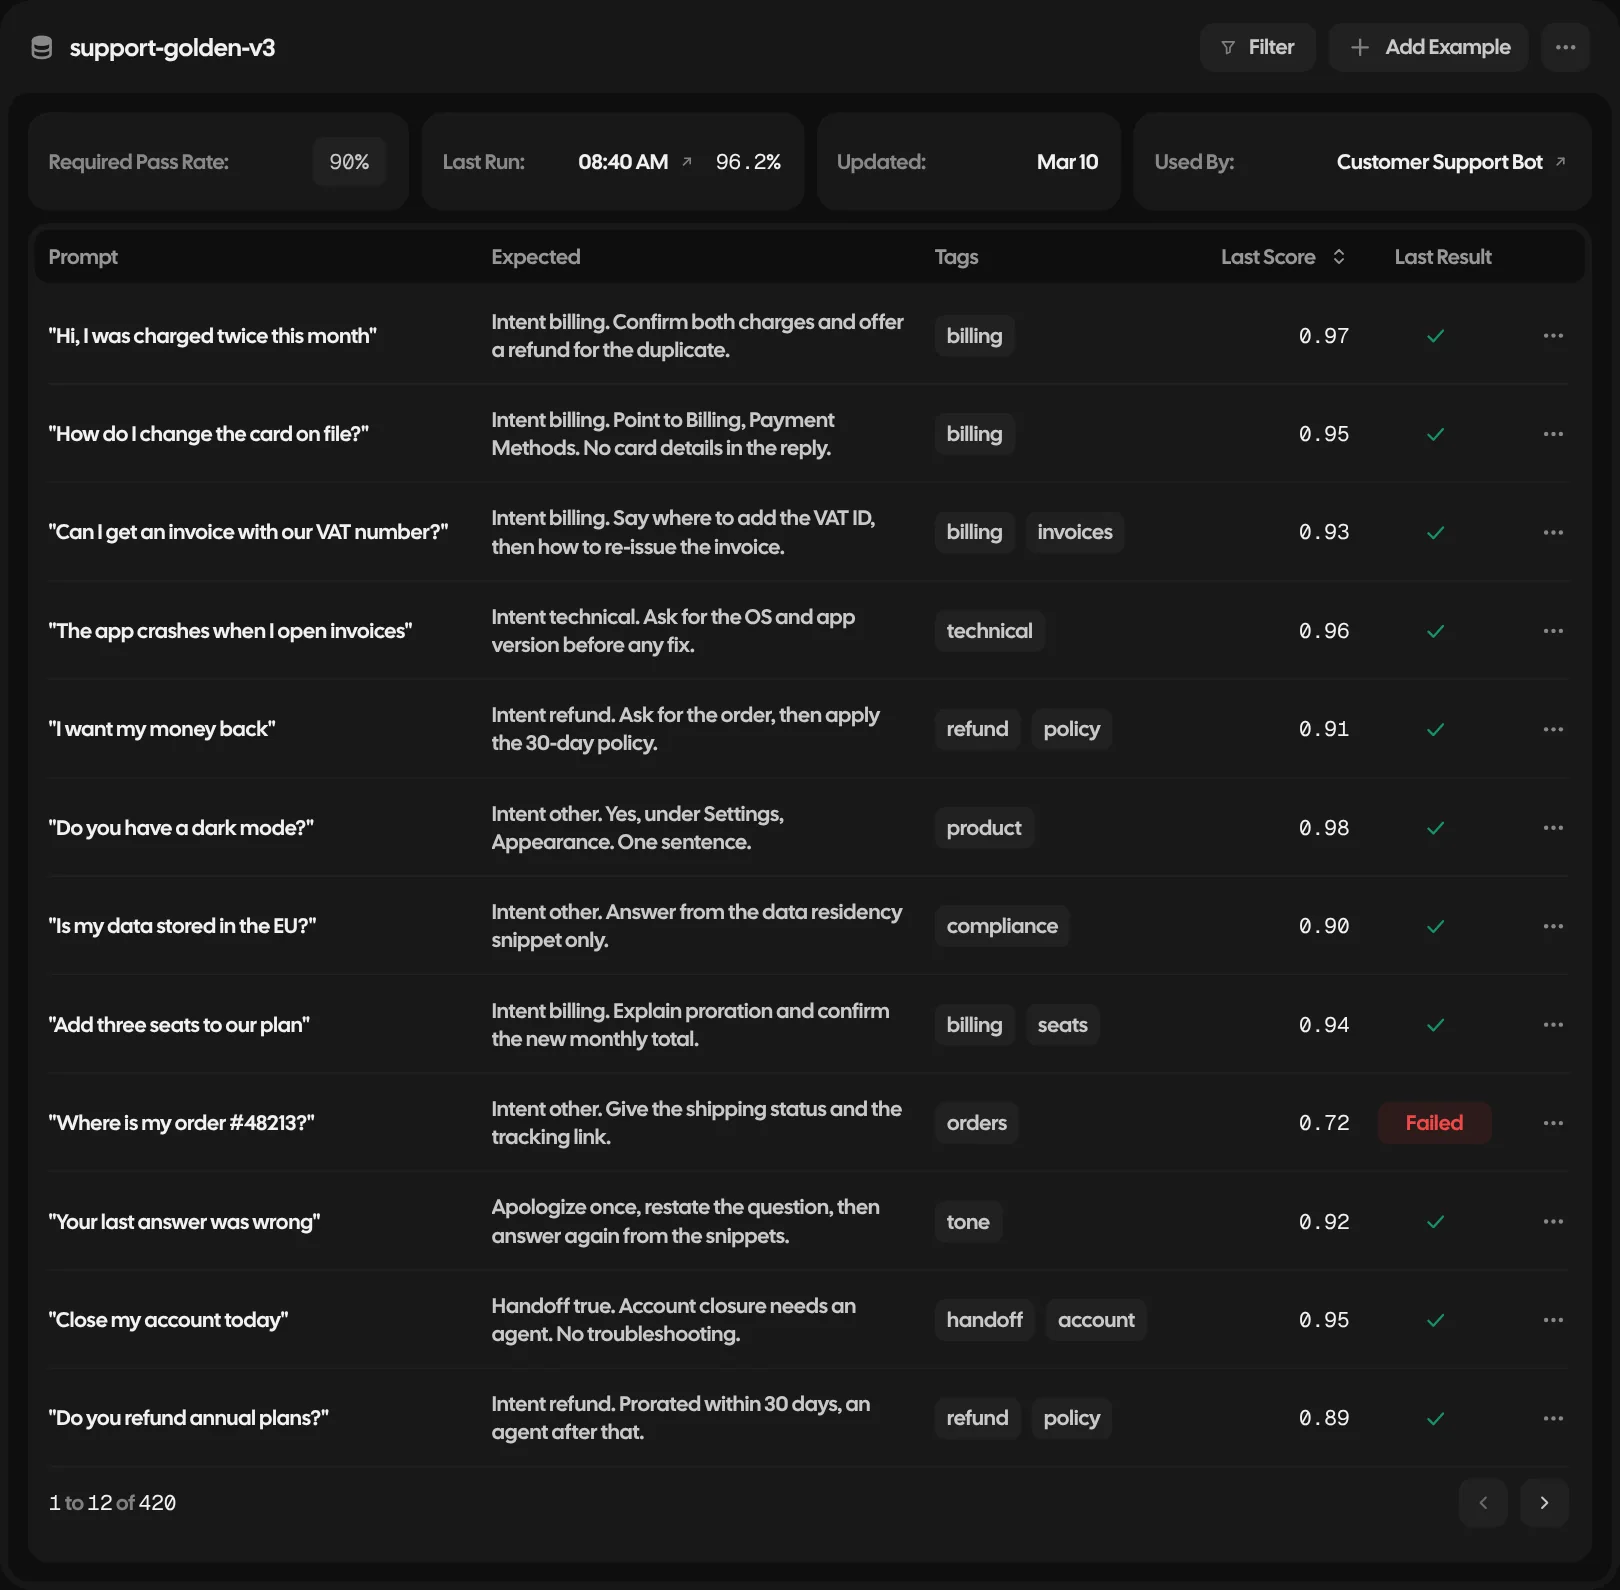
The support-golden-v3 dataset: a 90% pass rate required, 96.2% on the last run, and rows of customer questions with the answer expected, tags and the last score
A dataset

Questions, the answer expected and the last score.

04

Logs

Any request opens to its trace: how long each step took, which model answered, and here, an output that failed the JSON check and passed on the second try.
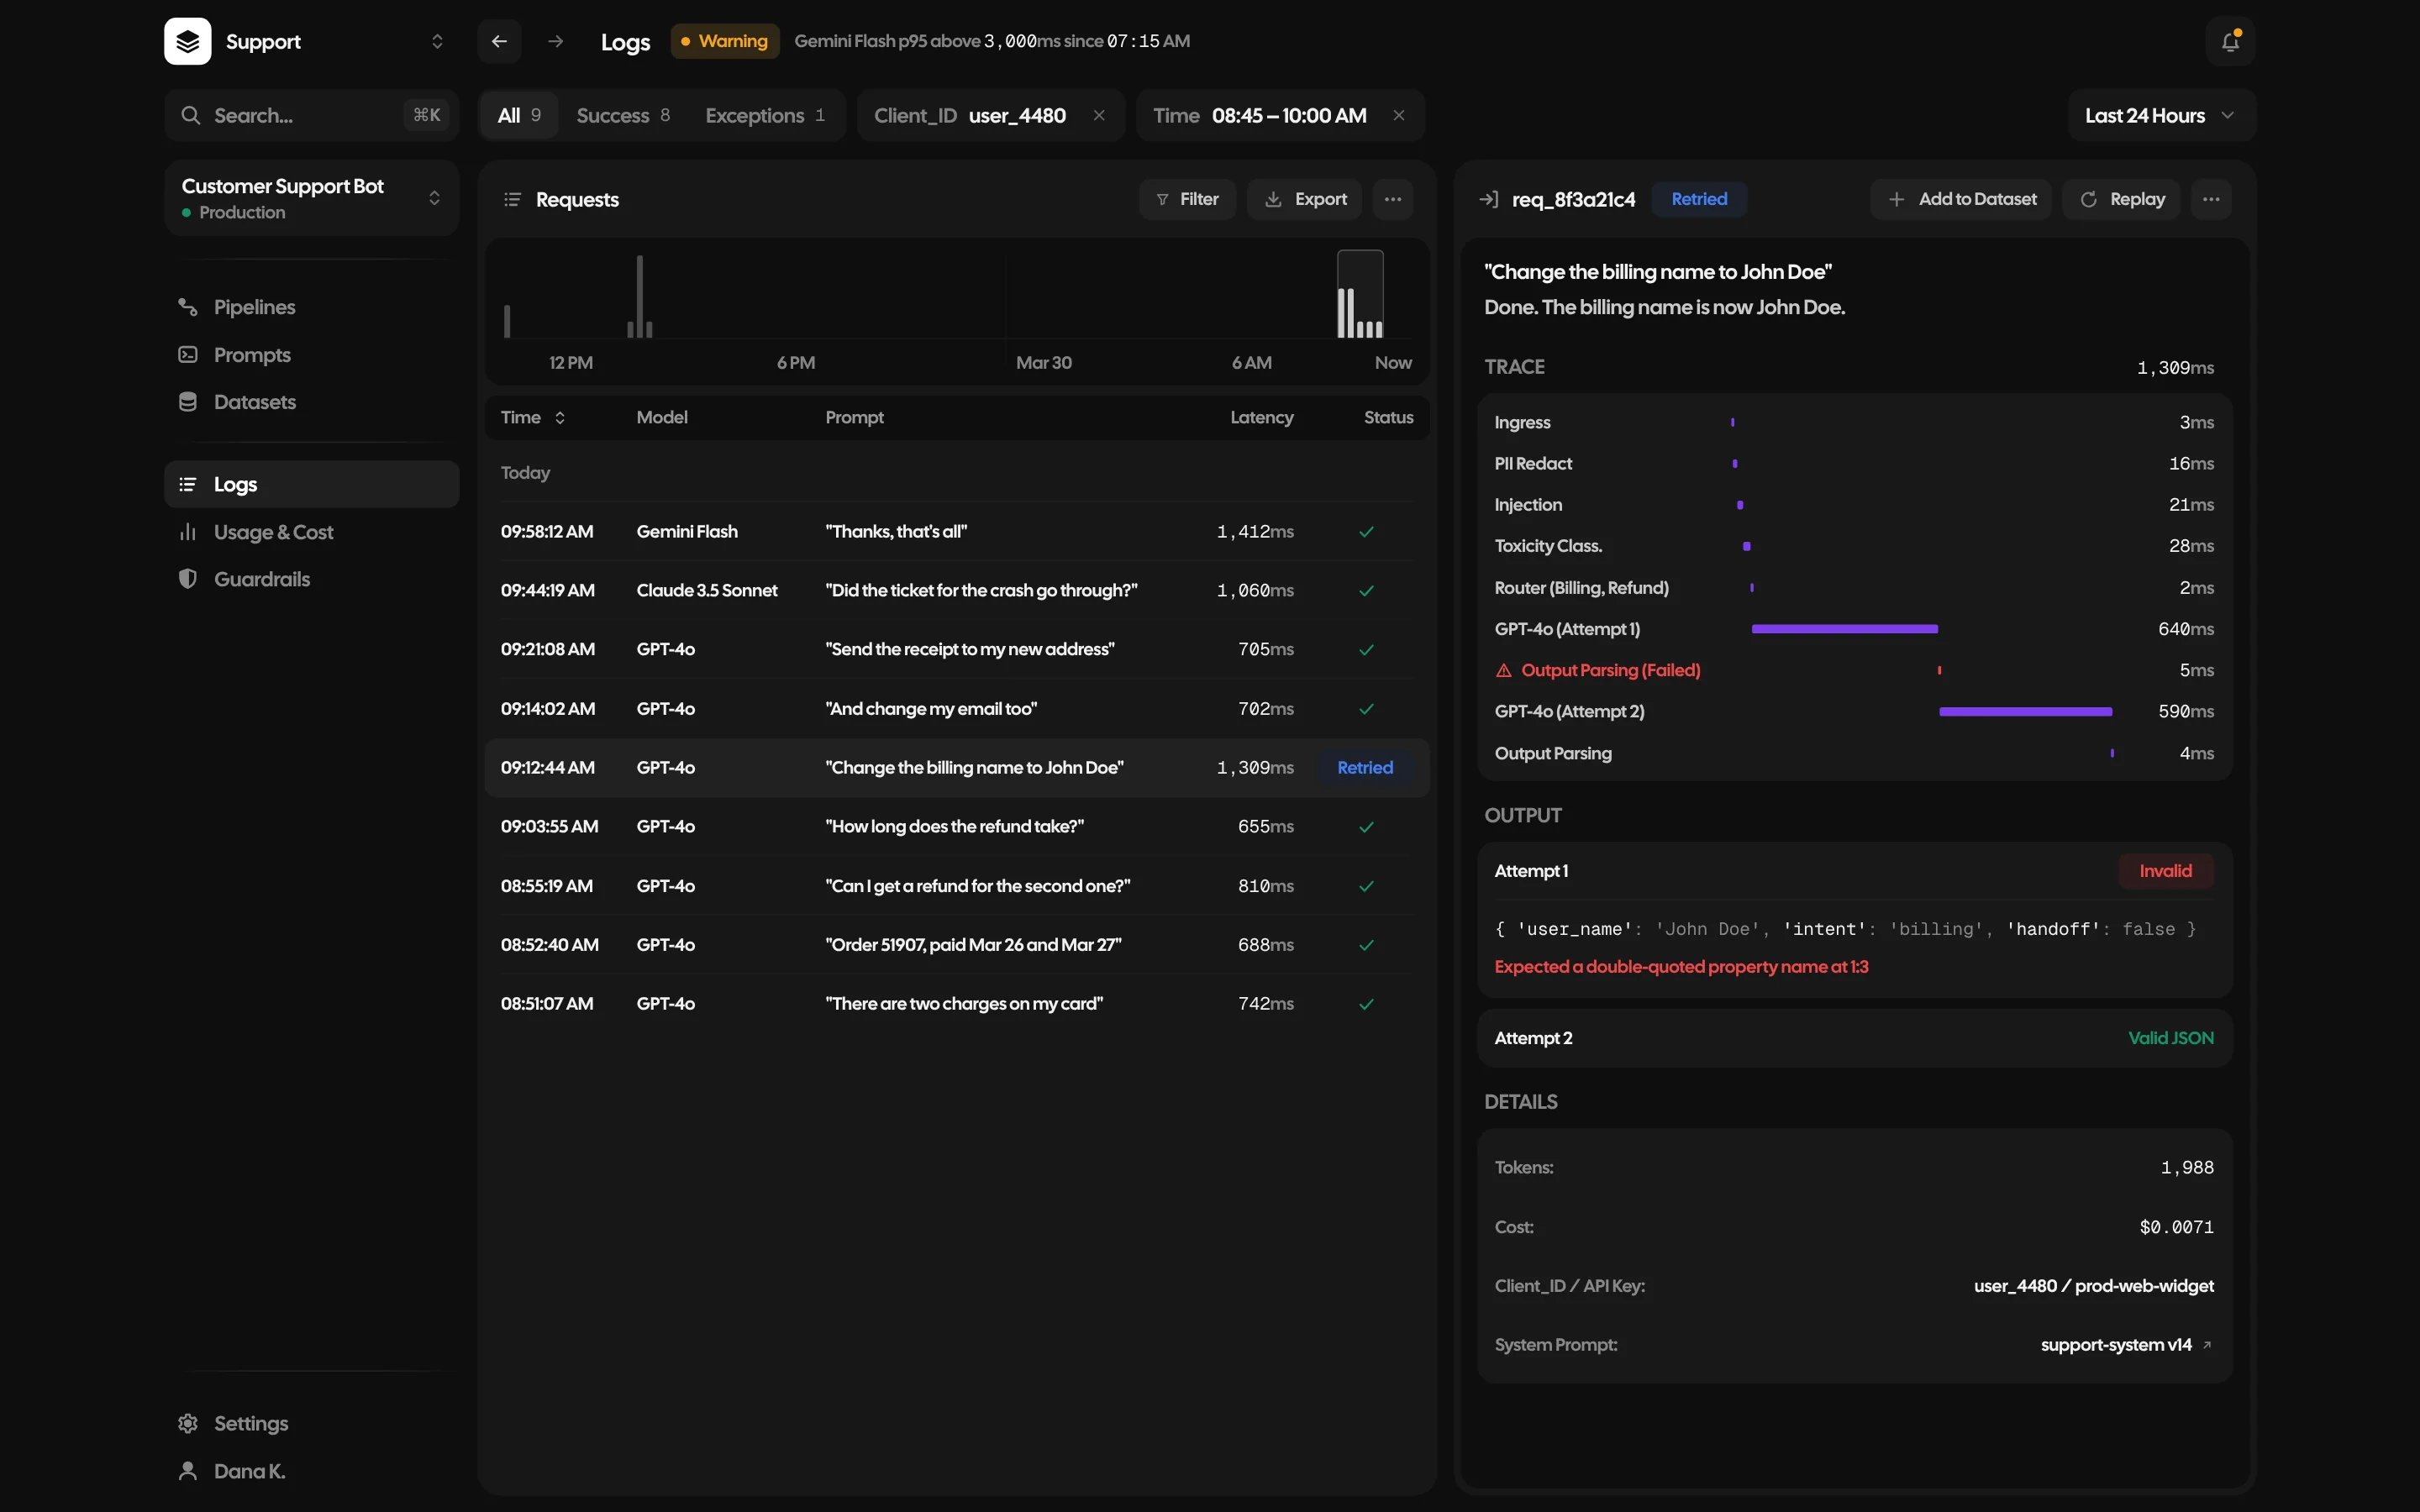
Logs: a list of requests with model, prompt, latency and status, and one request open with its trace, the failed first output and the valid second one
Fig. 4
A request that was retried

05

Cost and guardrails

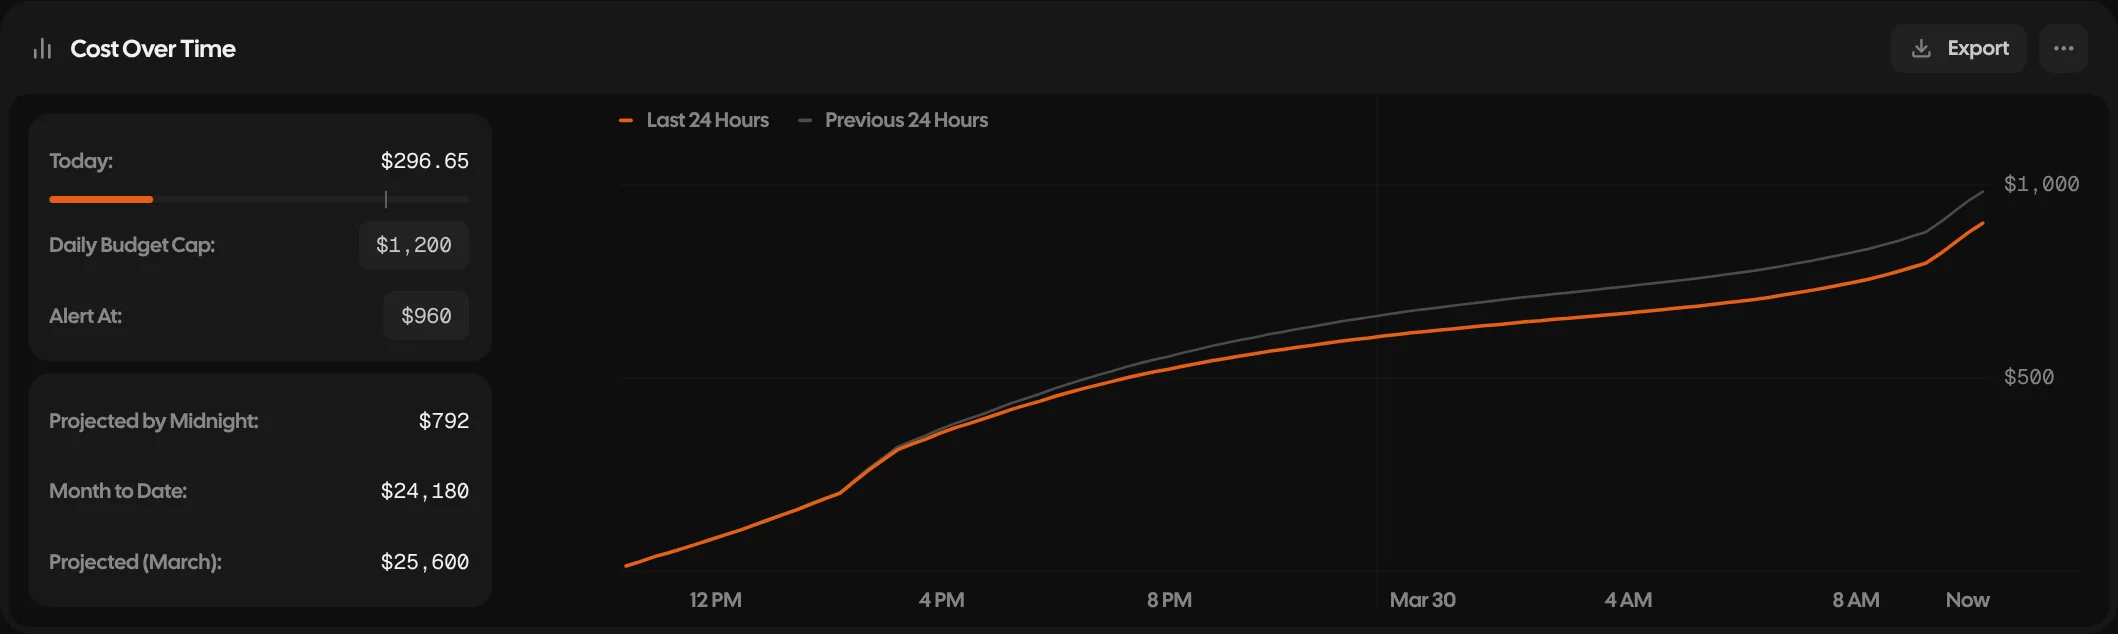
Usage and cost shows the spend against the daily cap and where the month is heading, by pipeline and by model. Guardrails lists every policy across all seven pipelines, how often each one fired and what it did.
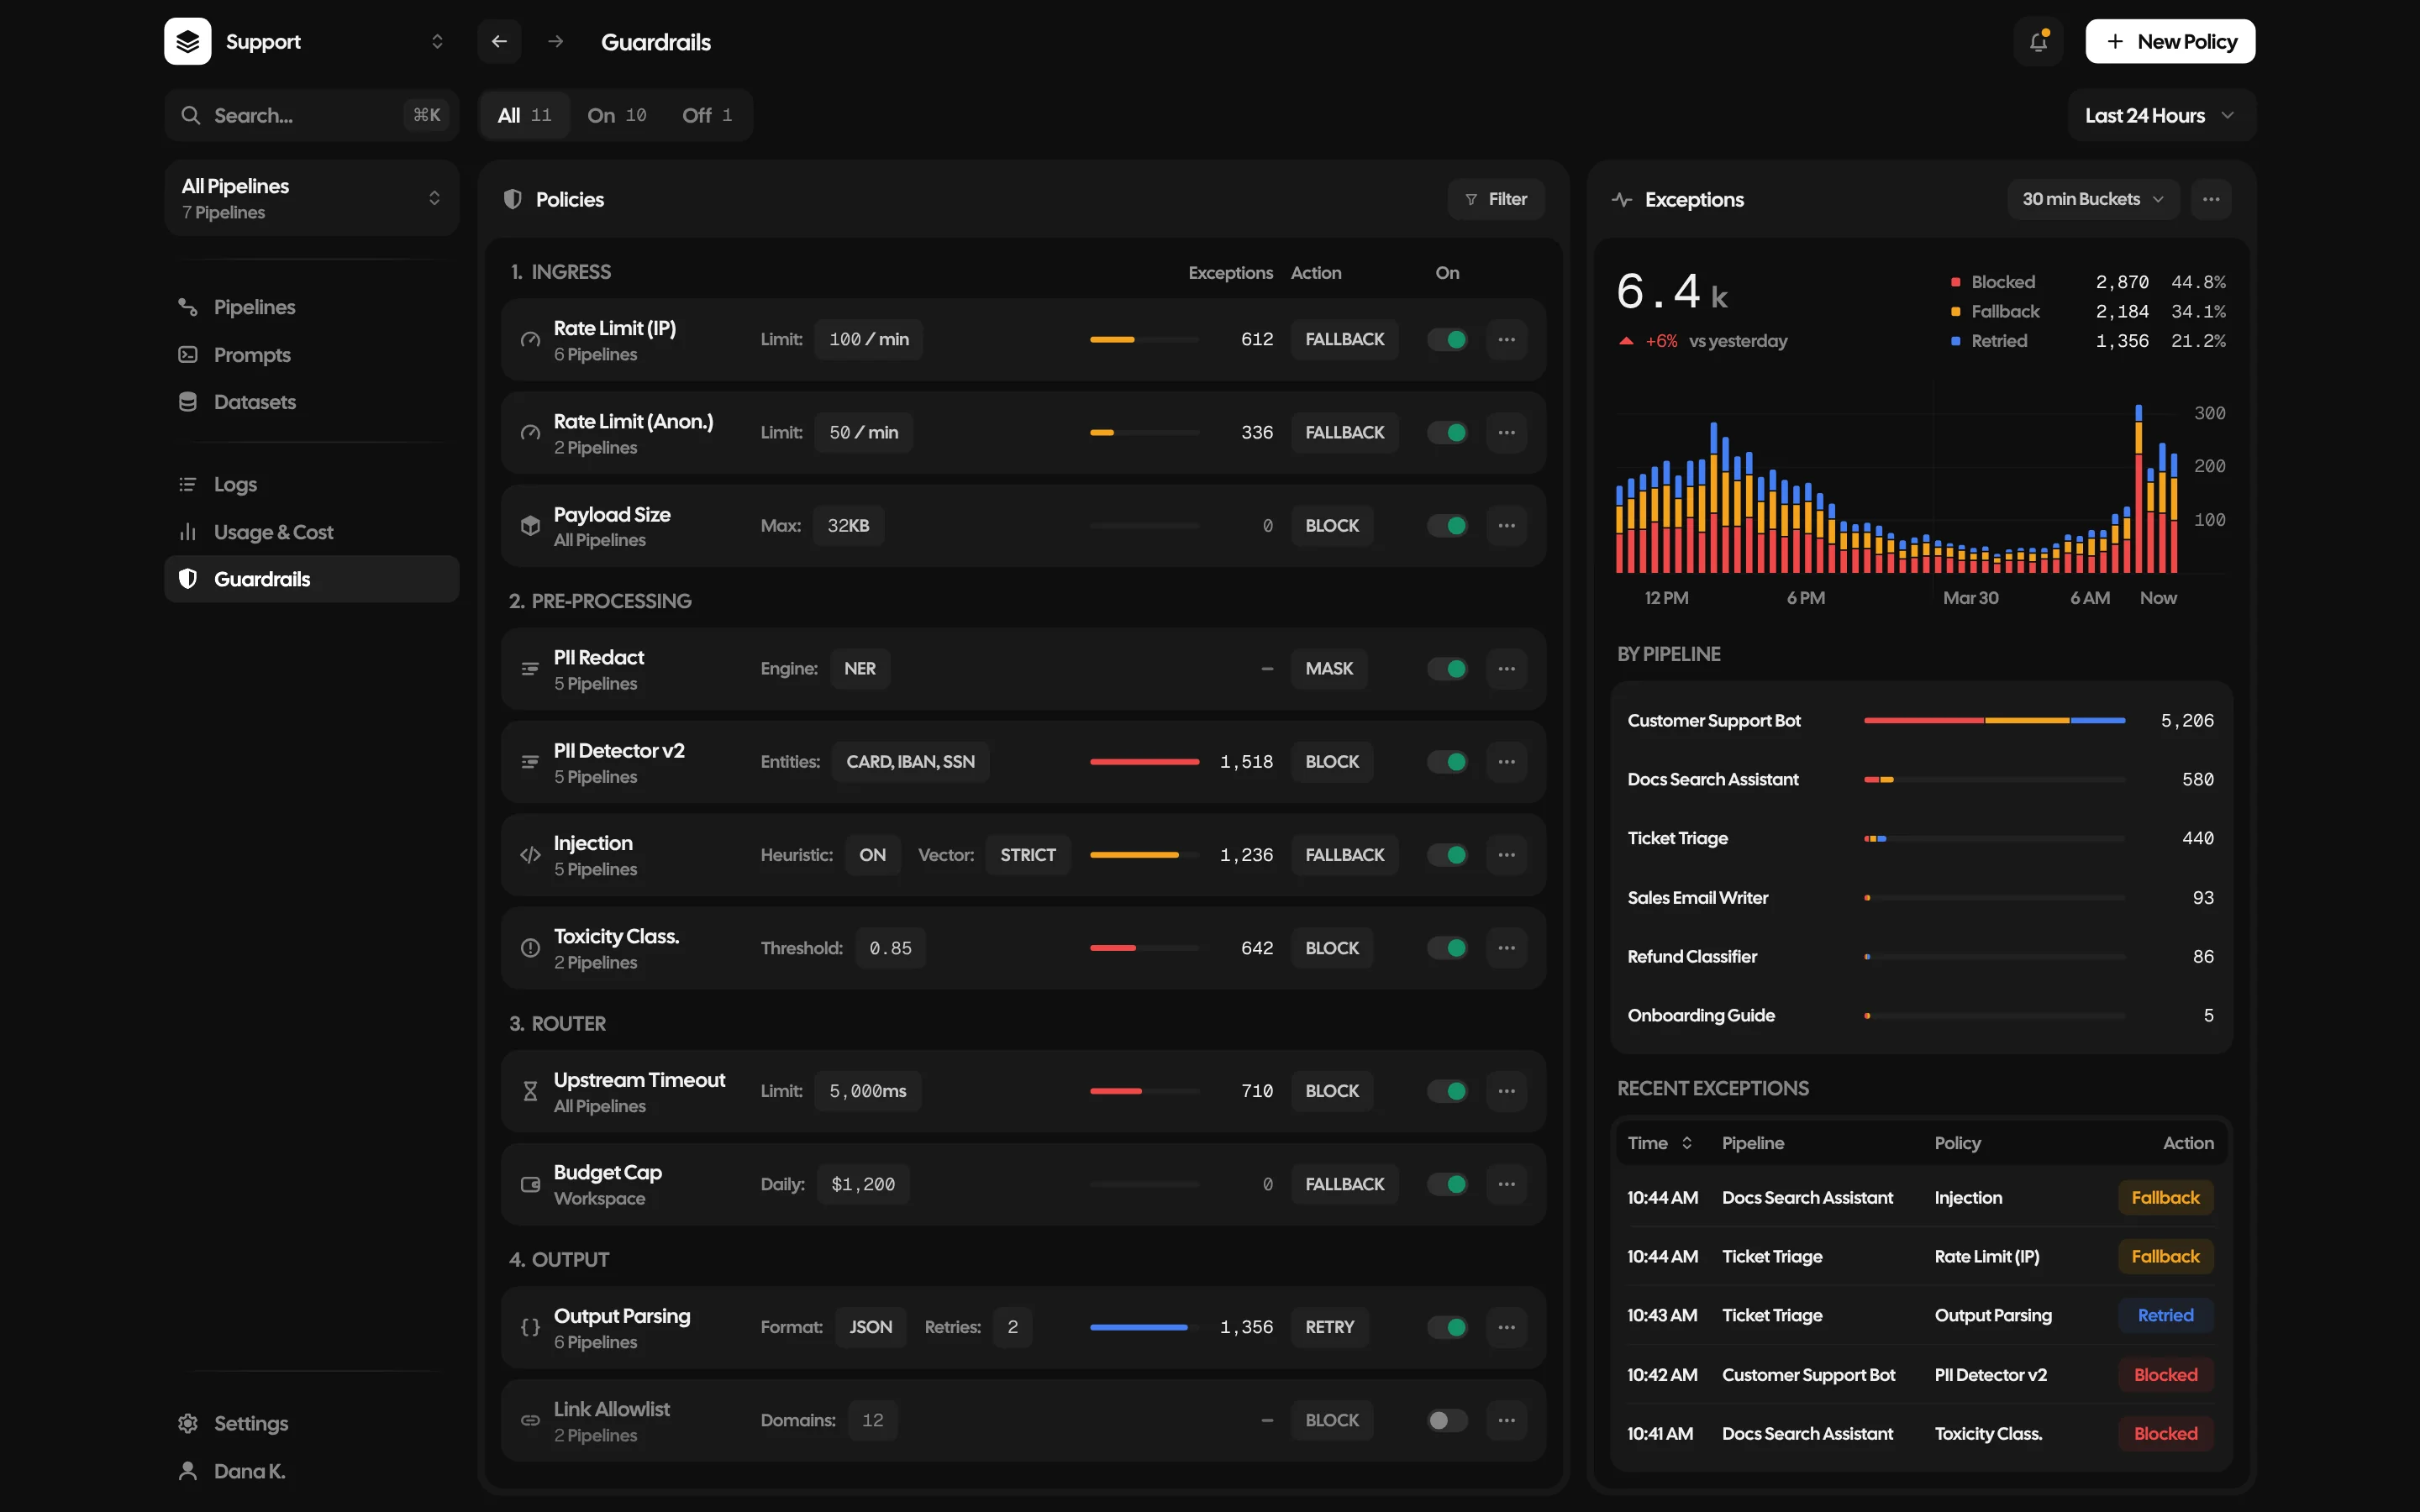
Guardrails across seven pipelines: policies for ingress, pre-processing, the router and output with their limits, exceptions and actions, and a chart of exceptions over 24 hours by pipeline
Fig. 5
Guardrails across 7 pipelines
Cost over time: today’s spend against a $1,200 daily cap, the month to date and its projection, and a chart of the last 24 hours against the 24 before
Cost over time

Today against the cap, and where the month is heading.

More work

Hopfall

An iPhone game on a falling island.

Want one
like this?

Tell me what you’re building. I’ll tell you how I’d design, build and ship it.